


On a normal day our Postgres database is at a cpu load of 20-40%. March 24th was not a normal day.
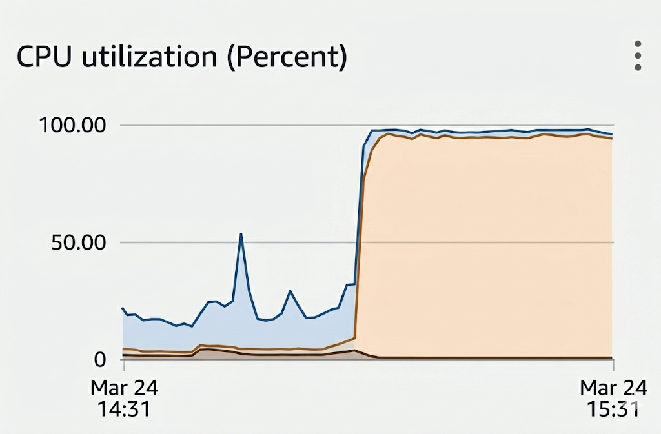
Suddenly, for no discernible reason, our database was slammed at 100% CPU. All of it in system time. Our bots couldn’t join calls, customers couldn’t query our API, dashboards were unresponsive, and we couldn’t even get a psql into the database.
The usual suspects were considered first: no there were no new deploys that morning, no current AWS incidents, swap usage was nominal, and all metrics before the incident looked normal.
We run our Postgres DB on AWS Aurora, which for the most part has been a pleasant experience: it’s highly available, scaling is trivial, there is great built-in disaster recovery, and RDS Proxy manages connections. However because it’s a managed service, we couldn’t get a shell into the database to run a more detailed analysis on where the heck this system time was going. What we would have given to run a simple vmstat! We did have database metrics from AWS (which suspiciously were still able to provide per-second granularity, despite the titanic system load).
When we have downtime, our customers experience downtime. That erodes the trust that our customers have with us, but more importantly it damages the trust that end users have in our customers. Everyone on the team is acutely aware of this dynamic and the seriousness of an incident of this severity added to the stress of the moment.
Without a readily apparent smoking gun, we focused on how to get our system back on its feet. Our first action was to reboot the database, in the hope that a fresh start would free the database from its death spiral. We use all the normal Postgres niceties to ensure data durability: WAL, fsync, data_checksums, synchronous_commit, full_page_writes. This lets us know that we can restart the database without the risk of losing customer data or corrupting anything. We hit the “reboot database” button and waited for our system to come back online, our eyes glued to the metrics dashboard.
And… Nothing

For 60 minutes we waited for the system to reboot. While every facet of our business had ground to a halt, RDS was doing who-knows-what even though simply pulling the power would have been sufficient. A typical EC2 instance can be rebooted in a few minutes from the console, regardless of whatever cursed code is running inside the instance. It’s still a mystery to me what RDS was waiting for.
With rebooting an apparent dead end, we had to search for other ways to relieve the pressure from our database. We had tens of thousands of EC2 instances all vying for access to our database. Each one adding to the crippling load.
One engineer had the clever idea to alter the security group for those instances, such that they would be denied access to the database. The queries that were already submitted would still run, but at least the connection count would decrease and we could restrict any new queries.
With this in place, the connections slowly started draining and 40 minutes later the DB was healthy enough to reboot. I’ve never been so happy to be booted from an instance.
With the database back up, user time was now pinning the CPU.
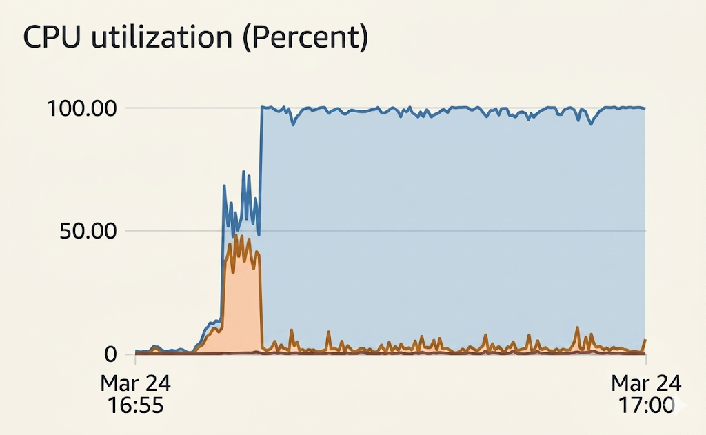
Progress!
This of course is a much more tractable problem. We had a backlog of tasks internally, customers were retrying their previously failed queries, and our database was in an unhealthy state given that suddenly all our bots were no longer interacting with the database as expected. We identified the expensive queries, removed them when possible, and did DB surgery to bring the load back to a stable place.
The question then became: how do we safely re-enable the networking security group on our instances? Once re-enabled the instances will try to process their queued DB events and the sudden revival of load could easily take down our database once again. The solution was to limit the connection count for the bot role in Postgres to a small number, and then re-enable networking through the security group. This way we could use the max connection count as a valve to safely ramp up usage of the DB.
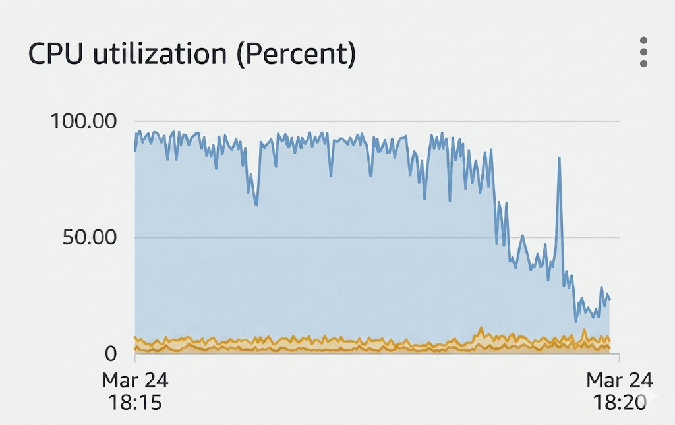
Happy DB
How the heck did this happen?
Looking through the Postgres logs something else immediately caught our eye:
LOG:  process 44916 still waiting for ExclusiveLock on extension of relation 24882112 of database 16398 after 1000.035 ms
DETAIL:  Process holding the lock: 91014. Wait queue: 4552, 41114, 64350,....
A massive lock convoy. 15,000 processes all waiting on a single index extension. That relation is a GIN index for the bot’s metadata.
One more interesting clue: the RDS metrics showed a brief IO spike immediately before the incident, where our disk IO was fully utilized.
But why did that burn so much system time?
All 15k connections were holding a WaitLatch on the relevant index extension.
(void) WaitLatch(MyLatch, WL_LATCH_SET | WL_EXIT_ON_PM_DEATH, 0,
                             PG_WAIT_LOCK | locallock->tag.lock.locktag_type);
Under the hood, this ends up being an epoll_wait(). This is quite lightweight until it’s woken up. Normally that only occurs during a handoff to the next waiter, which is a system SIGURG call, but is only for the waiter who is receiving the lock. The real killer, however, is CheckDeadlock.
Postgres needs to be able to detect and handle deadlocks, otherwise a single bad query would leak PIDs. It does this by setting a timeout (1 second for our database) after which it grabs the 16 partition locks for the table and navigates the lock graph to detect any deadlocks, rearranging wait queues if possible to resolve a deadlock.
for (i = 0; i < NUM_LOCK_PARTITIONS; i++)
        LWLockAcquire(LockHashPartitionLockByIndex(i), LW_EXCLUSIVE);
result = DeadLockCheck(MyProc);
for (i = NUM_LOCK_PARTITIONS; --i >= 0;)
        LWLockRelease(LockHashPartitionLockByIndex(i));
Our problem was that each of these PIDs started at the exact same time, so they hit the deadlock timer at the same time. That lock contention makes LWLockAcquire go into:
mustwait = LWLockAttemptLock(lock, mode);
...
LWLockQueueSelf(lock, mode);
...
for (;;)
{
    PGSemaphoreLock(proc->sem);
     if (!proc->lwWaiting)
        break;
     extraWaits++;
}
Now we had a second convoy.
The first convoy was on the relation extension lock. The second convoy was on the lock-manager partition locks used to check for deadlocks. All 15k processes woke up together, all tried to run CheckDeadLock(), and all tried to acquire the same tiny set of LWLocks. Those locks are normally held for a very short time, so the implementation is optimized for the common case: try an atomic compare-and-swap, queue if it fails, sleep on your process semaphore, and retry when woken.
The relation extension locks cannot actually participate in a deadlock cycle. Postgres knows this:
if (LOCK_LOCKTAG(*lock) == LOCKTAG_RELATION_EXTEND ||
      (LOCK_LOCKTAG(*lock) == LOCKTAG_PAGE))
      return false;
As a result, the database spent enormous CPU time repeatedly waking thousands of backends, acquiring global lock-manager partition locks, and proving that no deadlock was possible.
And because log_lock_waits was enabled, each backend that survived long enough also walked the wait queue and formatted a massive log line containing holders and waiters. Each log line string-formatted every PID in the wait queue and was 10KB+ long!
We reproduced this failure mode locally in two parts. The Postgres reproduction created the extension-lock convoy and 15k+ PID wait queues. A stripped-down latch/signal storm reproduced the missing CPU symptom directly. We observed 100% total CPU with system time pinned around 86%, while perf showed the hot path in signal delivery, epoll_wait, timer interrupts, scheduler work, and pipe writes.
Why did it happen on a GIN Index?
GIN index extensions are no more expensive than a normal B-tree index extension. The problem is that with concurrent writes, GIN index extensions can be much more frequent than a B-tree index extension.
- B-tree: extends only when a page split finds no recyclable pages in the FSM. Splits happen at O(1/fanout) frequency relative to inserts — roughly once per ~200 inserts for a typical leaf page.
- GIN pending list: extends every time
makeSublistneeds a new pending list page. With concurrent inserts, each insert that overflows the tail page triggers aGinNewBuffer. The pending list accumulates pages untilginInsertCleanupfires (atgin_pending_list_limit, default 4MB = ~512 pages), then drains back to the FSM. During a write burst before cleanup, the FSM is empty and every overflow triggers an actual file extension.
But why now?
The most fascinating thing when performing the post-mortem investigation was how quotidian all the main metrics were – save for one: we had hit a new peak load of concurrent bots.
The way our system works is that each bot will emit a BotEvent as it progresses through its lifecycle. One for when the underlying server is ready, one for when the bot is in_waiting_room, and one for when it is joining_call. BotEvents are their own table, but through a trigger they update a status field on the bot, which is indexed as we frequently want to query bots based on where they are in their lifecycle.
The silent killer for our database was that joining_call event. People all typically hold their meetings at the top of the hour, or slightly less frequently on the half hour. So for the tens of thousands of instances we have, they suddenly all write a BotEvent at the exact same time. This causes a change to the Bot index, so we suddenly need to alter and extend every corresponding index. Normally this is fine – adding the BotEvent is normally so quick that it doesn’t register in our metrics – but with an unusually large load we surpassed our provisioned IO on the underlying volume. When this happens AWS will insert latency to bring the IO to within your provisioned allotment. When that delayed transaction was an index extension, everything else gets piled behind that transaction. In a system operating at scale, that’s enough to take down your entire database.
What we learned
- Set up monitoring on the wait queue so that we know when there is a lock convoy and how large it is. Small ones are rarely enough to take down a system, but it doesn’t take much to make it spike to an unreasonable level that can cause company-wide damage.
- Keep fields that need a GIN index on their own table, such that changing the main table doesn’t require updating the GIN index.
- Designing bursty systems at scale is an engineering challenge. Any operation that ends up synchronized requires extra attention. Even small operations, when synchronized and at scale, can become calamitous.
These are the kinds of thorny engineering challenges that we solve at Recall.ai. We focus on solving the most challenging aspects of a problem, because that’s how we’re able to deliver the maximal amount of value to our customers. The engineers on our team are all given a lot of agency to take on hard problems and drive them from design, implementation, and support. For example, I’m currently redesigning our entire infrastructure with the goal of reducing our costs. So far, I’ve driven the cost down by around 100k per month. Once this project is complete, I think I can bring that cost savings all the way to around 400k per month. I was able to do that almost entirely solo (but building upon the great work of my peers).
If this sounds like the job for you: a high impact role working with driven engineers to solve hard problems in a rapidly expanding market, reach out! We want to work with the best.
