


At Recall.ai we run an unusual workload. We record millions of meetings every week. We send meeting bots to calls so our customers can automate everything from meeting notes, to keeping the CRM up-to-date, to handling incidents, to providing live-feedback on the call and more.
Processing TB/s of real-time media streams is the thing we get asked most about. However an often-overlooked feature of meetings is their unusual synchronization. Most meetings start on the hour, some on the half, but most on the full. It sounds obvious to say it aloud, but the implication of this has rippled through our entire media processing infrastructure.
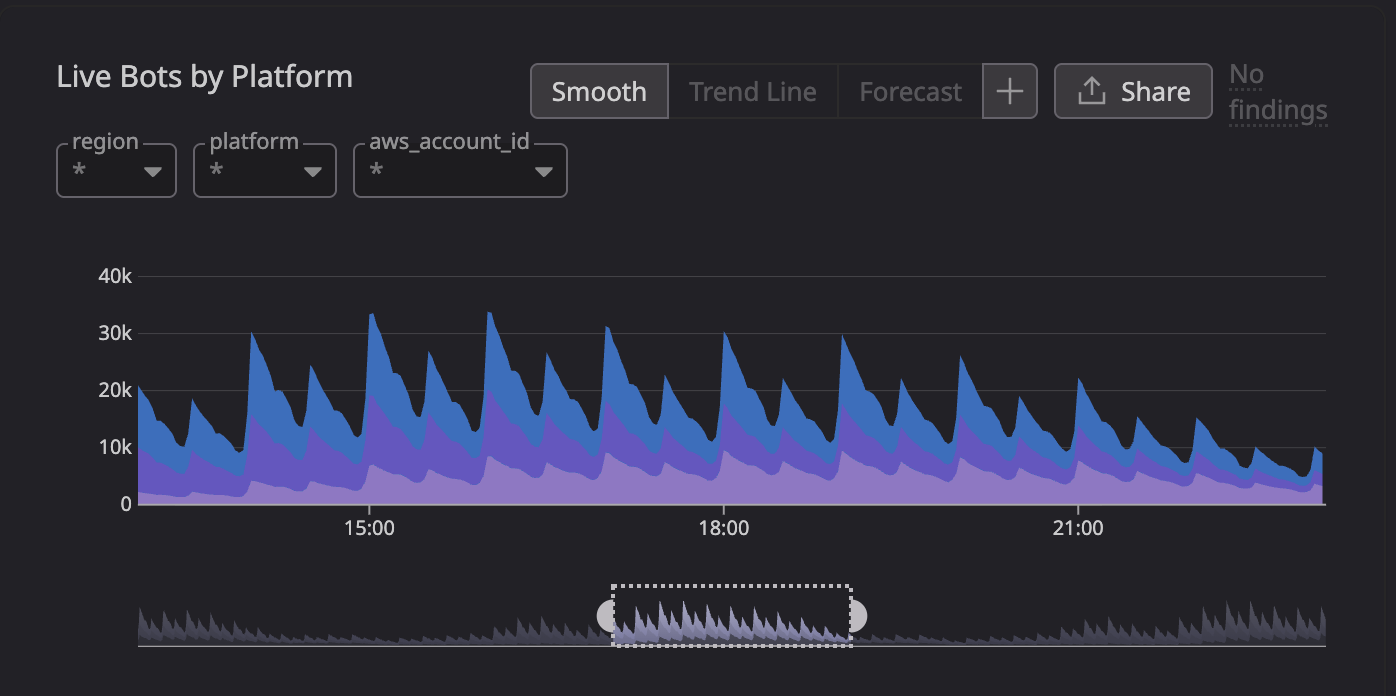
This is a picture of our load pattern. The y-axis is the number of EC2 instances in our fleet. Those large spikes are the bursts of meetings that we need to capture. And when the meeting starts, the compute capacity must be ready to process the incoming data, or it will be lost forever.
The extreme gradient of these spikes has resulted in us running into bottlenecks at almost every layer of the stack, from ARP to AWS. This is the story of a stubbornly mysterious issue, that led us to deeply examine postgres internals (again) and uncover an often overlooked postgres bottleneck that only rears its head at extremely high scale.
TL;DR
Every postgres server starts and ends with the postmaster process. It is responsible for spawning and reaping children to handle connections and parallel workers, amongst other things. The postmaster runs a single-threaded main loop. With high worker churn, this loop can consume an entire CPU core, slowing down connection establishment, parallel queries, signal handling and more. This caused a rare, hard-to-debug issue where some of our EC2 instances would get delayed by 10-15s, waiting on the postmaster to fork a new backend to handle the connection.
Slow connections to postgres
Months ago we got alerted to large spike of delayed EC2 instances. We immediately investigated only to find that all of them were actually ready and waiting. We initially suspected a slow query caused the delay but we ruled this out. Eventually we uncovered that the delay originated from additional time connecting to postgres.
Postgres has its own binary wire protocol. The client sends a startup message, to which the server responds with an auth request.
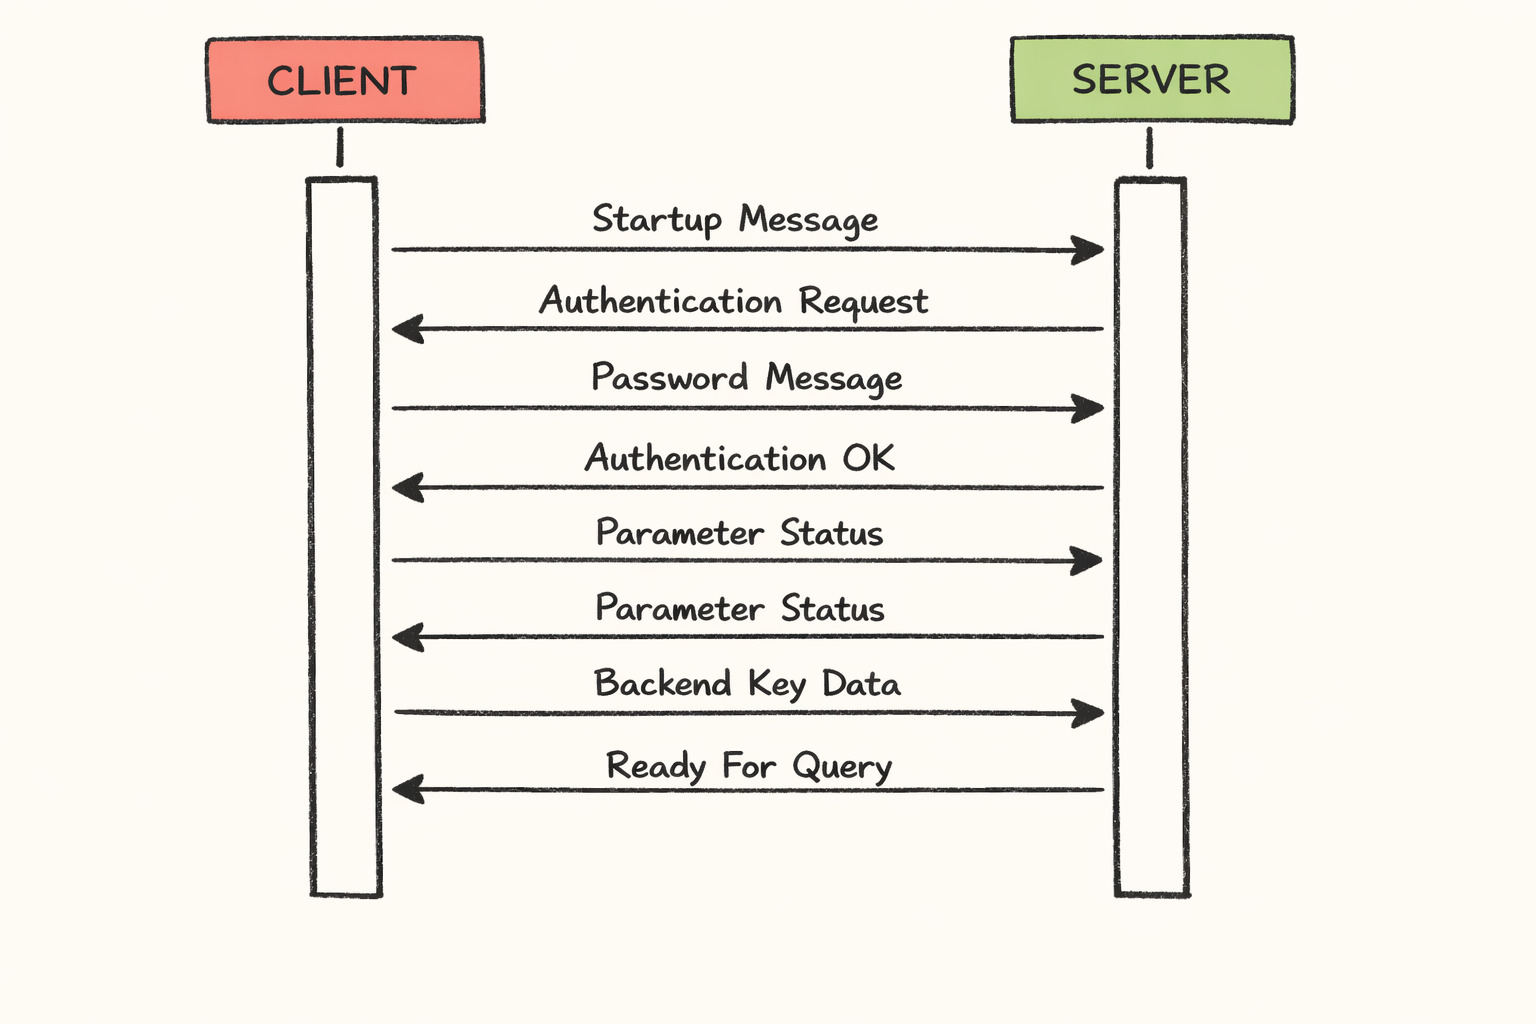
What we observed was truly bizarre, the client would successfully establish a TCP connection to postgres, however the startup message only receive a response after 10s. Here is a example what we saw:
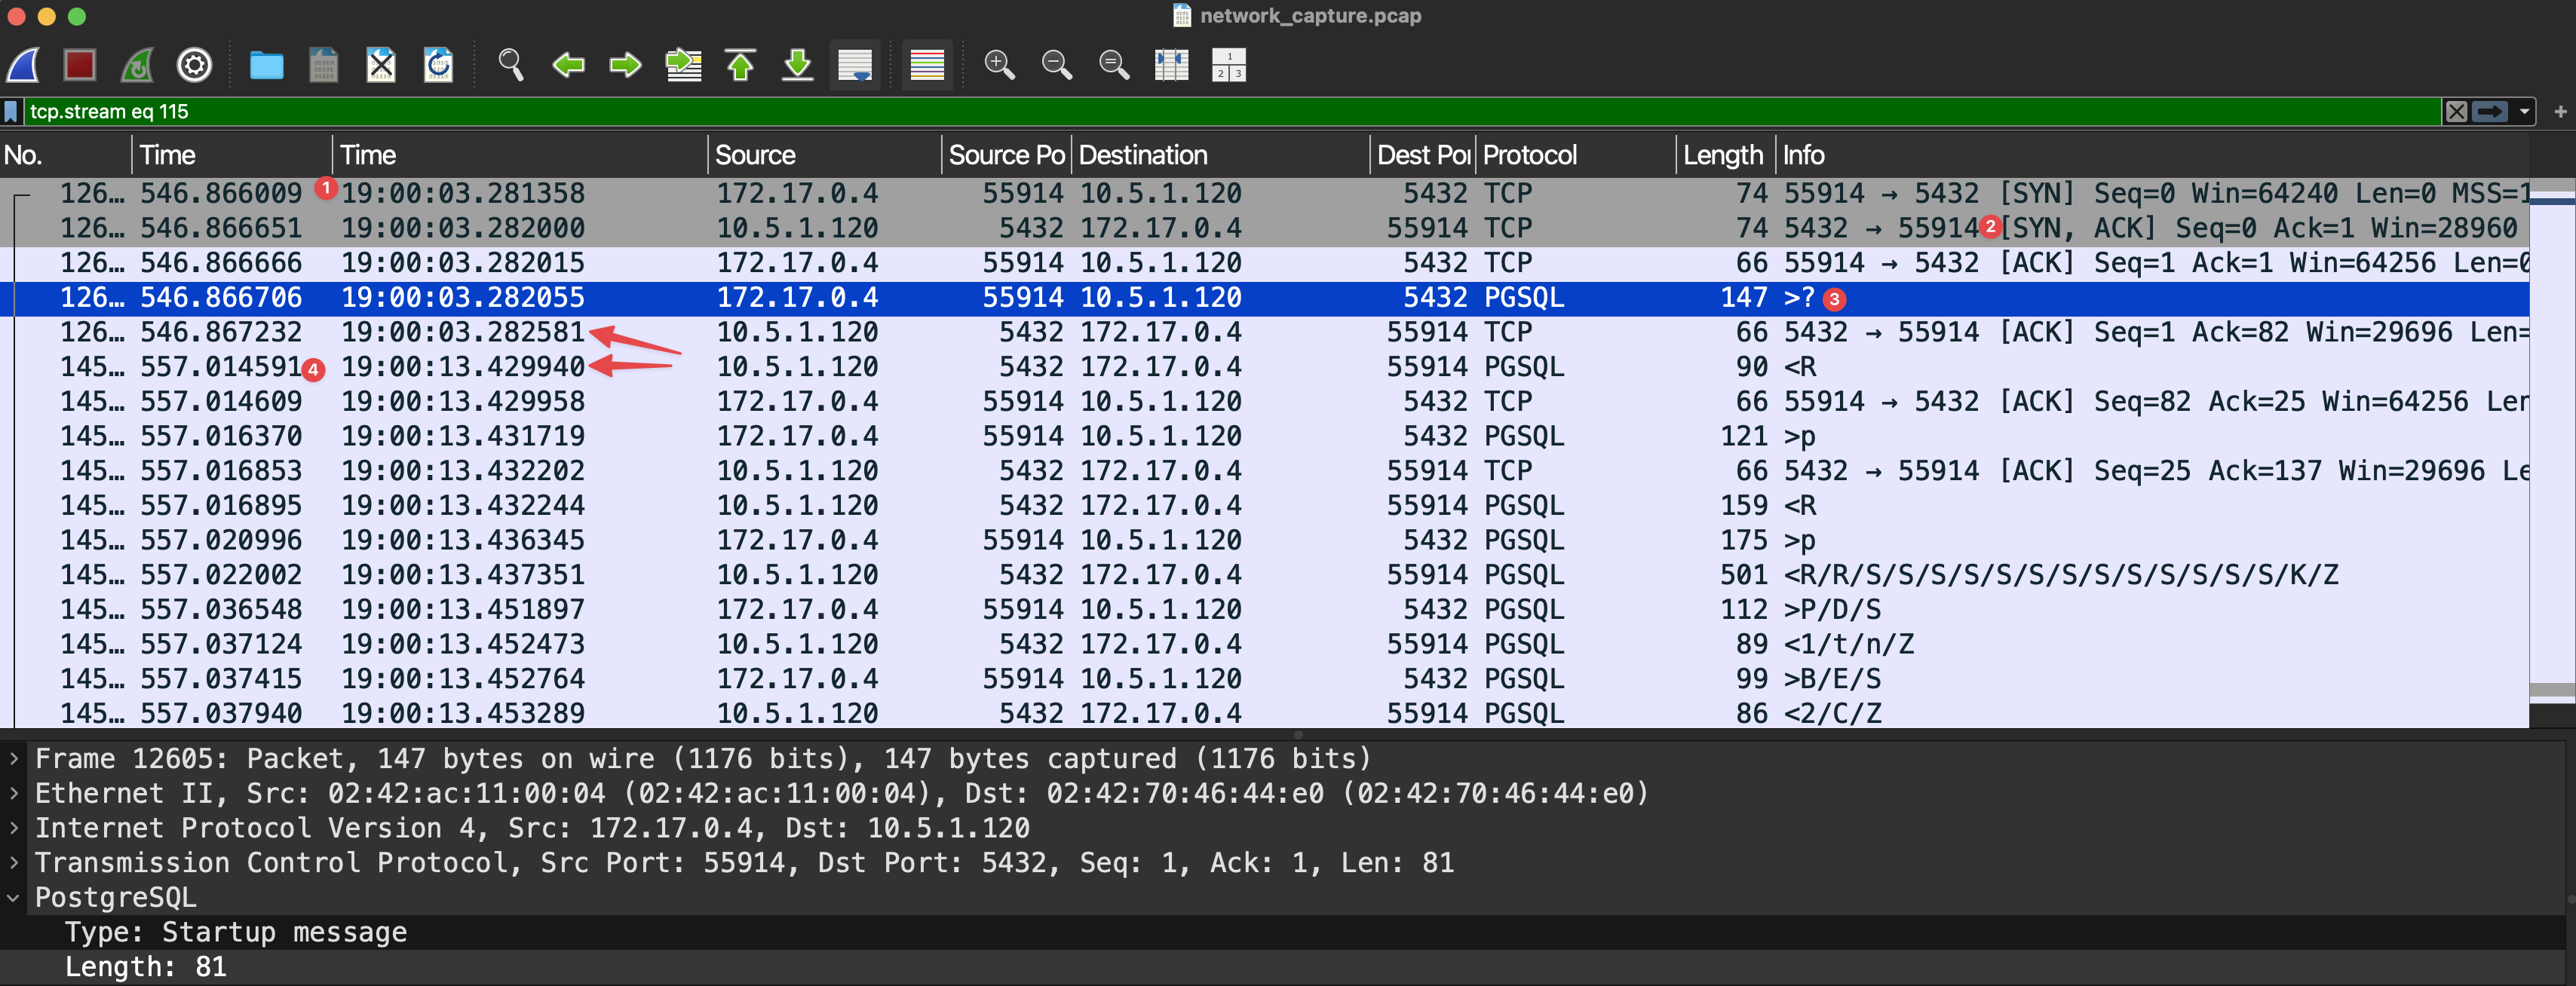
- The initial TCP SYN packet is sent from the client
- Less than one millisecond later the server responds with a SYN,ACK and the client ACK's to establish the connection
- The client send the startup message to the postgres server and the server ACK's the message
- 10s later the server responds with an auth request and the connection continue nominally from there
We ruled out obvious resource bottlenecks such as CPU, memory, disk I/O, network I/O and so forth. With all of these metrics looking nominal we turned to a deeper inspection of postgres internals.
A reproduction environment
We observed that the delay only occurred during the largest spikes, when many thousands of EC2 instances were booting. Notably, it seemed to occur sporadically, maybe only once or twice a week. We host our database on RDS Postgres, which complicated the matter as low-level telemetry is limited. So we resorted to creating a production-like reproduction environment that we could use to continue our investigation.
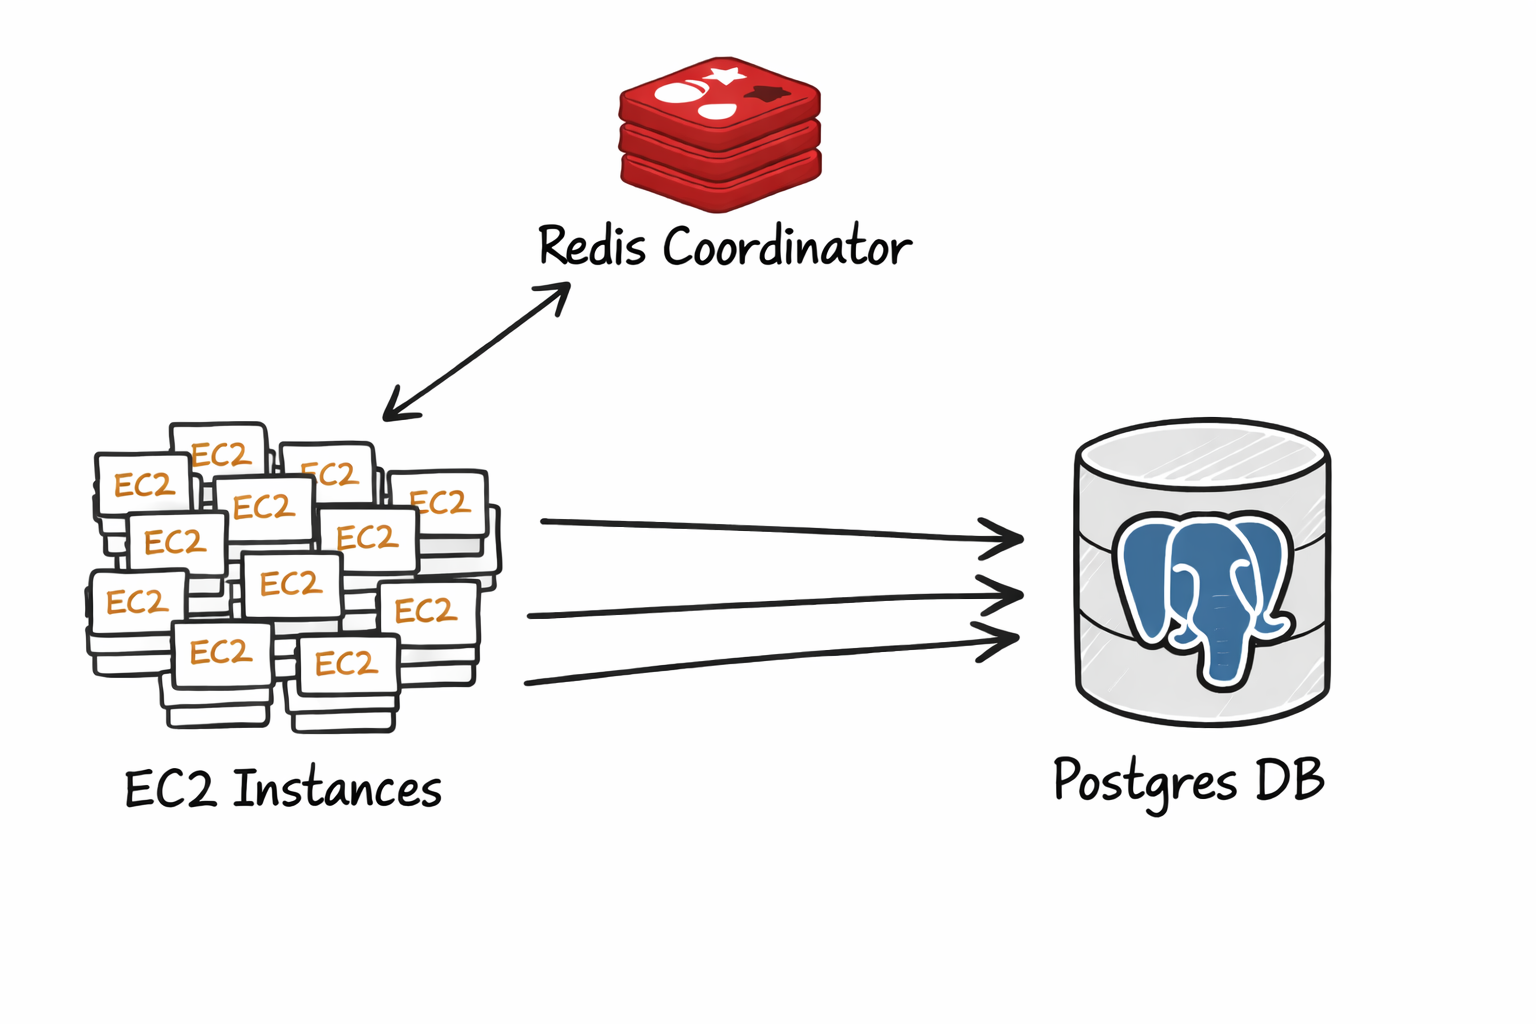
In this setup we used redis pub/sub to trigger a highly synchronized connection to postgres from a fleet of 3000+ EC2 instances. As we installed postgres on its own EC2 instance, we were able to instrument it while reproducing the delay.
A deep dive into the postmaster
The next step was to form a hypothesis which we could validate. To do this we inspected the postgres source code.
Every postgres has a supervisor process that is responsible for spawing and reaping new backends and workers. This process is called the postmaster (I love this name). The postmaster is designed as a single-threaded server loop that processes its events synchronously.
- ServerLoop
- ChildReaper: Reap exited child processes (workers, backends, etc).
- AcceptConnection: Launch a new backend to handle a connection.
- LaunchBackgroudWorkers: Launch background workers for a parallel queries.
Our hypothesis was that the burst of new connections would temporarily overwhelm the postmaster loop, causing it to lag behind the queue of incoming connections.
Profiling the postmaster
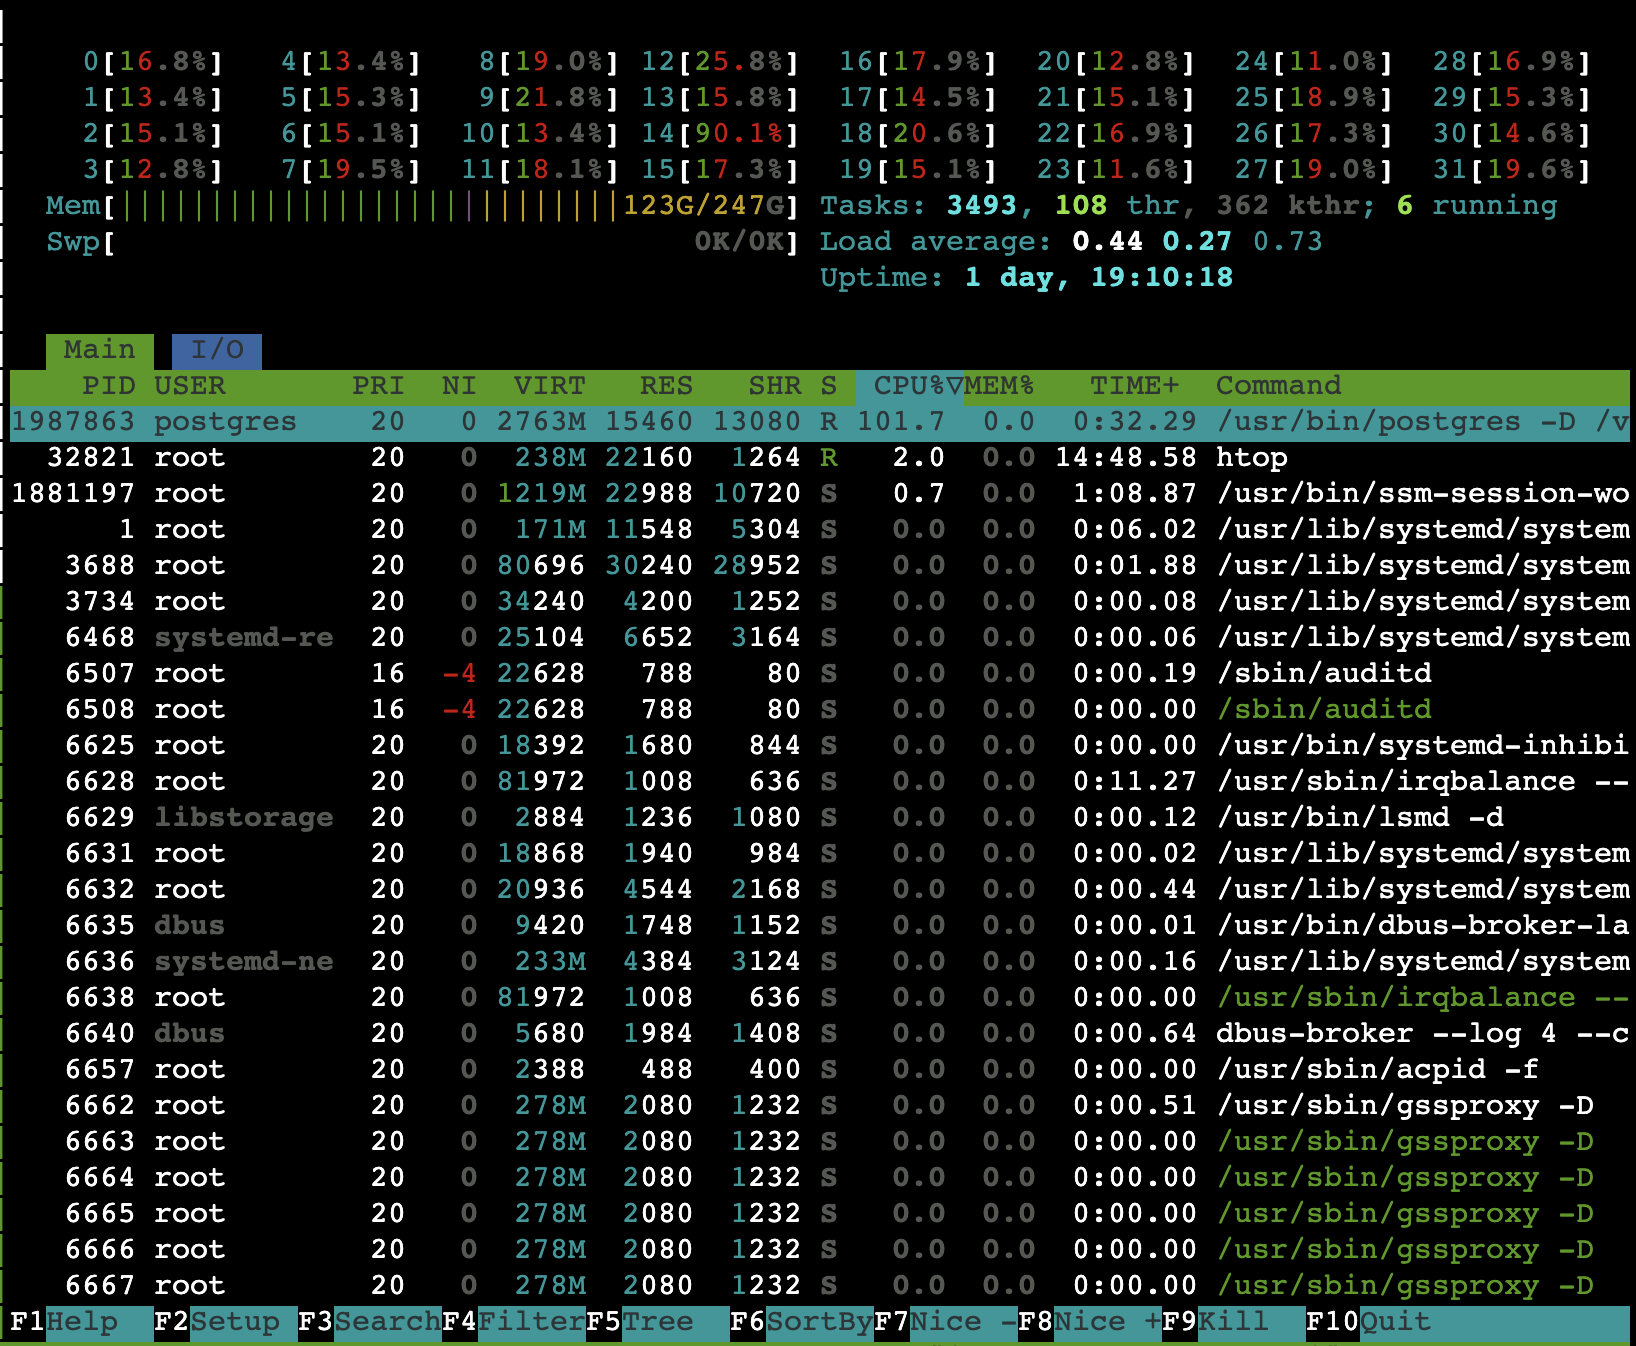
To do this we profiled the postmaster process under these periods of connection spikes in our simulated environment. It was surprisingly easy to pin the postmaster process.
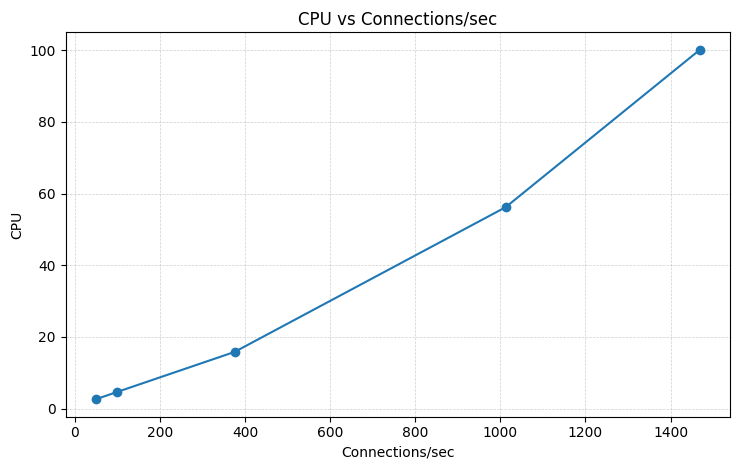
We ran the postgres on a r8g.8xlarge instance.
At about ~1400 connections/sec we saturated the postmaster main loop and start to observe noticable delays.
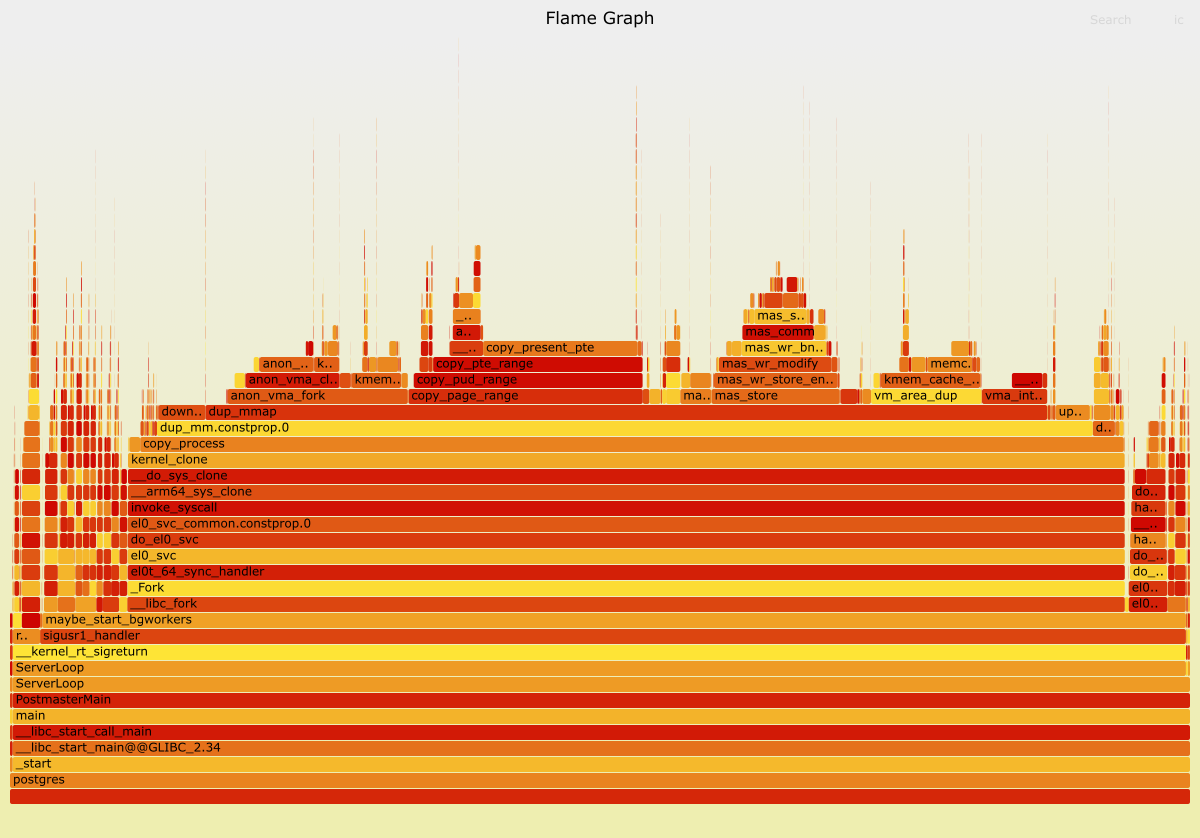
Use perf we took sampling profile of the postmaster while it was under duress.
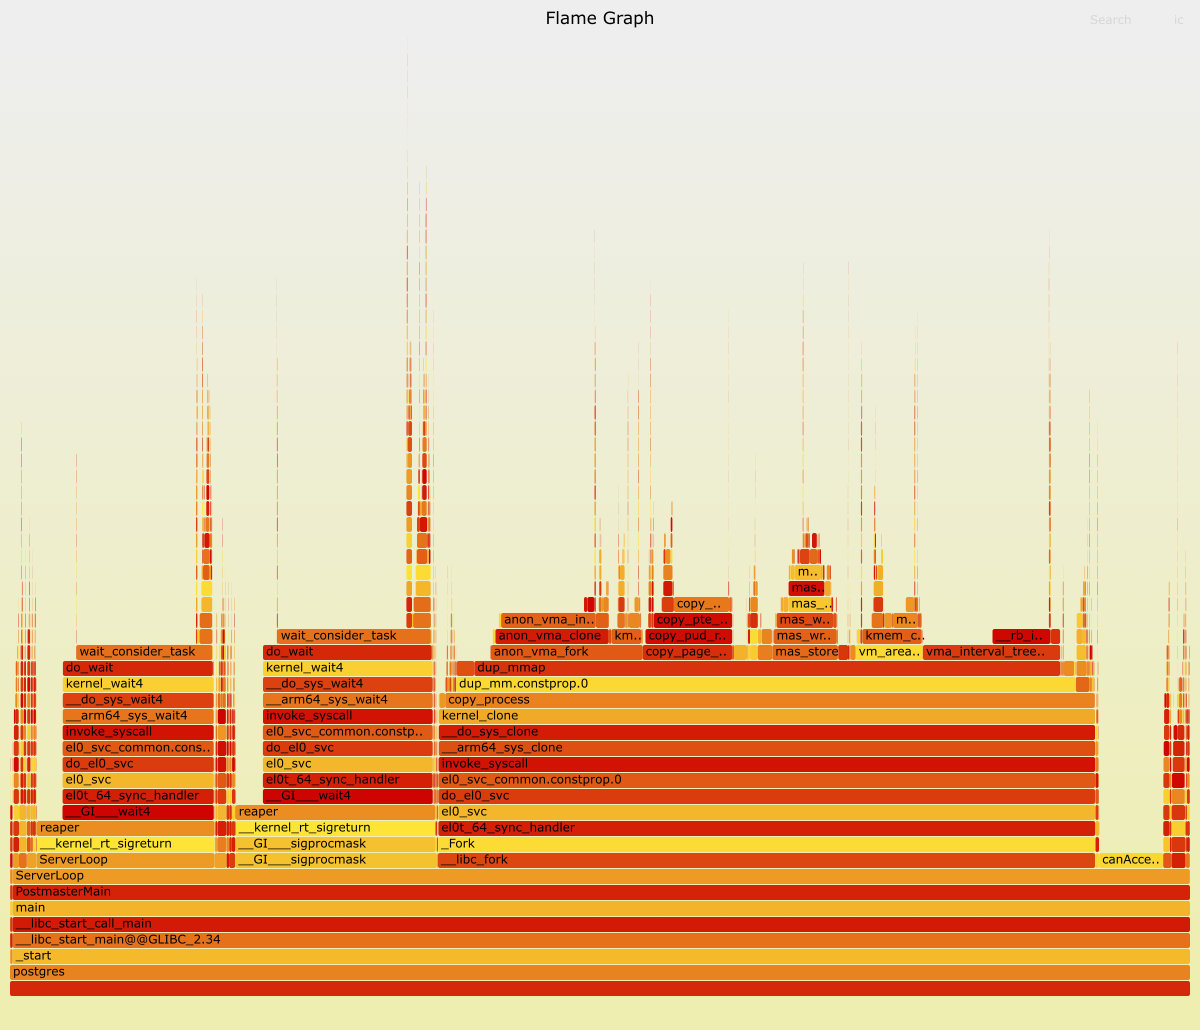
As expected the overwhelming majority of the time is spent spawning and reaping backends. It turns fork can be expensive!
Huge pages
A quick aside on how fork on linux works. When you call fork, it spawns a new "child" process, an exact duplicate of the parent continuing from the same instruction as the parent.
However, copying the parent's memory pages would be prohibitively expensive for how fork is typically used. So linux employs a trick here, the pages are Copy-on-Write. This optimization means the copy only happens when the child process tries to modify a parent's memory page.
There is a catch however, linux still needs to copy the parent's page table entries (PTEs).
Reducing the number of PTEs decreases the overhead of forking the process.
On Linux this is easy to do. You can enable huge pages in the kernel using sudo echo $NUM_PAGES > /proc/sys/vm/nr_hugepages and configuring postgres to use them.
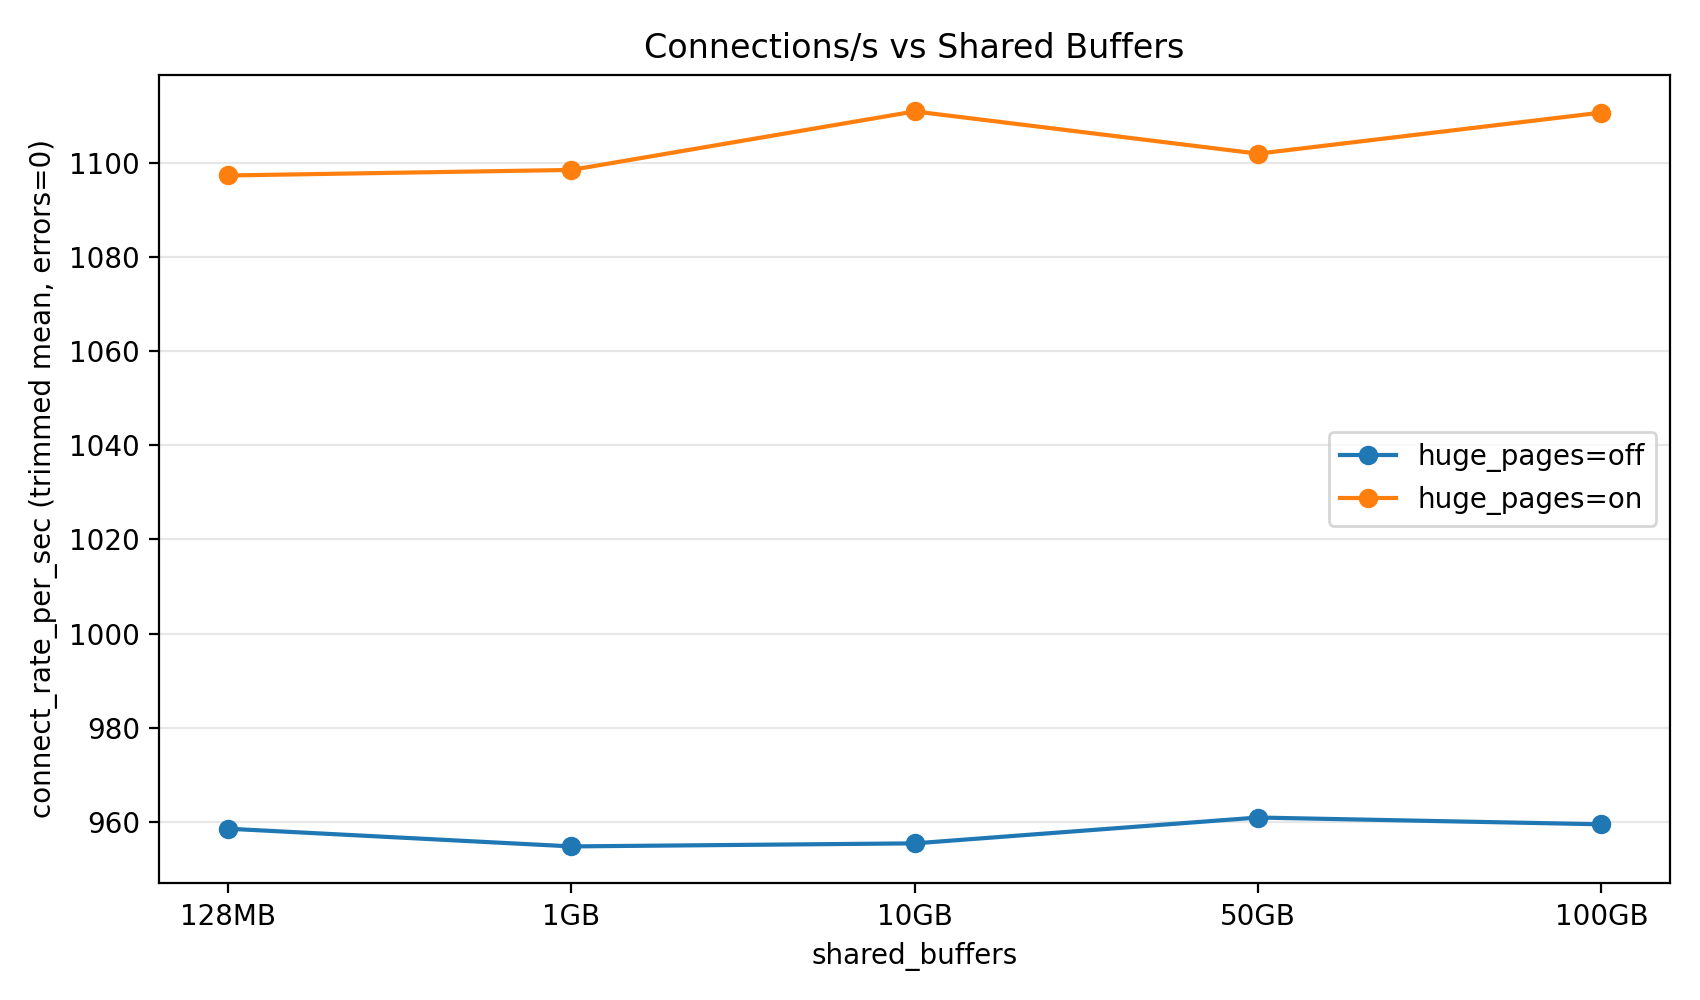
Enabling huge pages results in a large reduction in the postmaster PTE size.
Empirically we found a 20% throughput increase in connection rate with huge_pages = on.
Background workers
To further complicate the matter, the postmaster is also responsible for launching background workers for parallel queries. A high rate of parallel queries further increases increase the stress on postmaster main loop.
CREATE OR REPLACE FUNCTION bg_worker_churn(iterations integer)
RETURNS void
LANGUAGE plpgsql
AS $function$
DECLARE
  i int;
BEGIN
  PERFORM set_config('force_parallel_mode','on', true);
  PERFORM set_config('parallel_setup_cost','0', true);
  PERFORM set_config('parallel_tuple_cost','0', true);
  PERFORM set_config('min_parallel_table_scan_size','0', true);
  PERFORM set_config('min_parallel_index_scan_size','0', true);
  PERFORM set_config('enable_indexscan','off', true);
  PERFORM set_config('enable_bitmapscan','off', true);
  PERFORM set_config('parallel_leader_participation','off', true);
  PERFORM set_config('max_parallel_workers','512', true);
  PERFORM set_config('max_parallel_workers_per_gather','128', true);

  CREATE TABLE data (id BIGINT);
  INSERT INTO data SELECT generate_series(0, 100000);
  ANALYZE data;
  FOR i IN 1..iterations LOOP
    PERFORM sum(id) FROM data;
  END LOOP;
  DROP TABLE data;
END;
$function$;
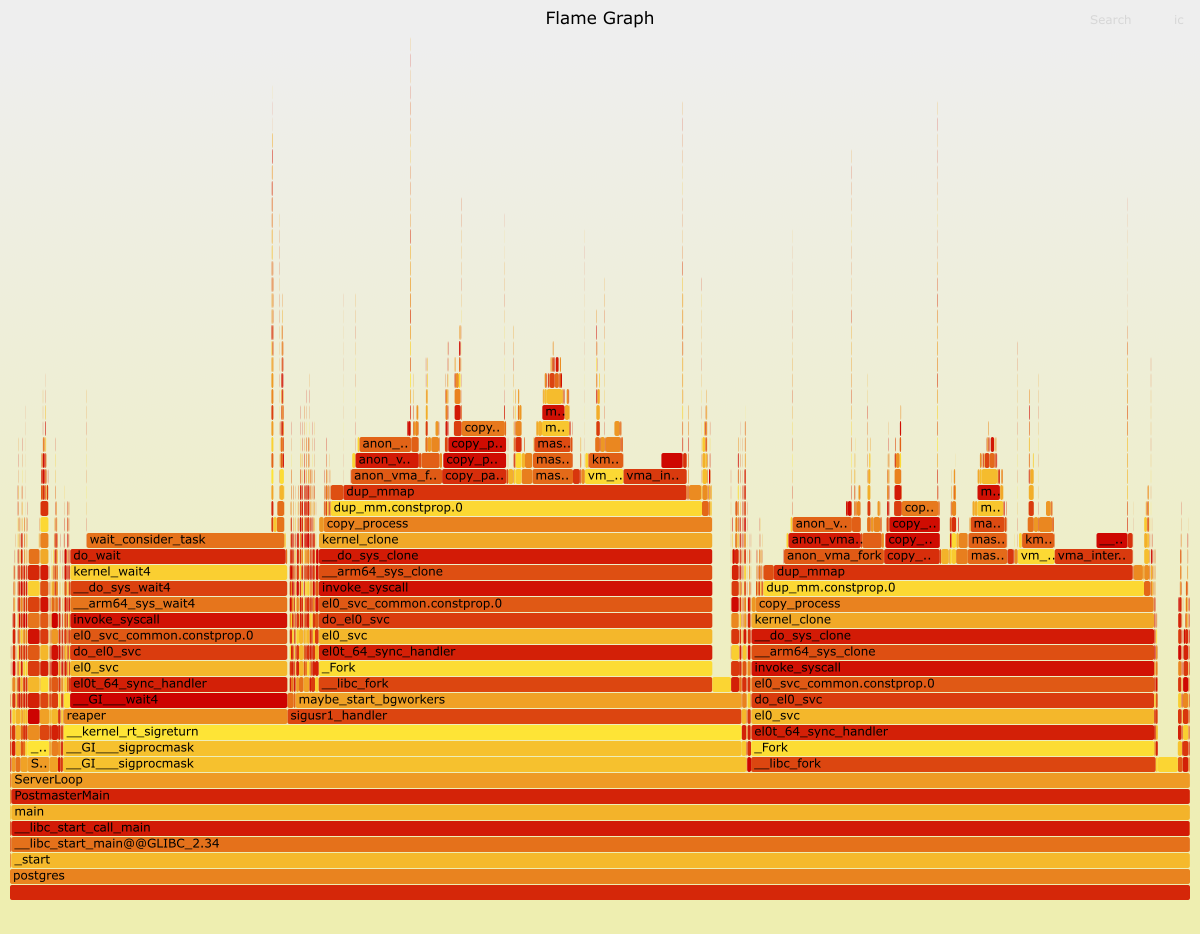
A high background worker churn rate also puts pressure on the postmaster main loop.
Unravelling the mystery
In production we only observed the connection delays sporadically. We determinated that was due to a confounding factor of increased background worker churn.
The smoking gun was in our database monitoring the whole time, which showed the spike in background worker shutdown load at the time of the delay.
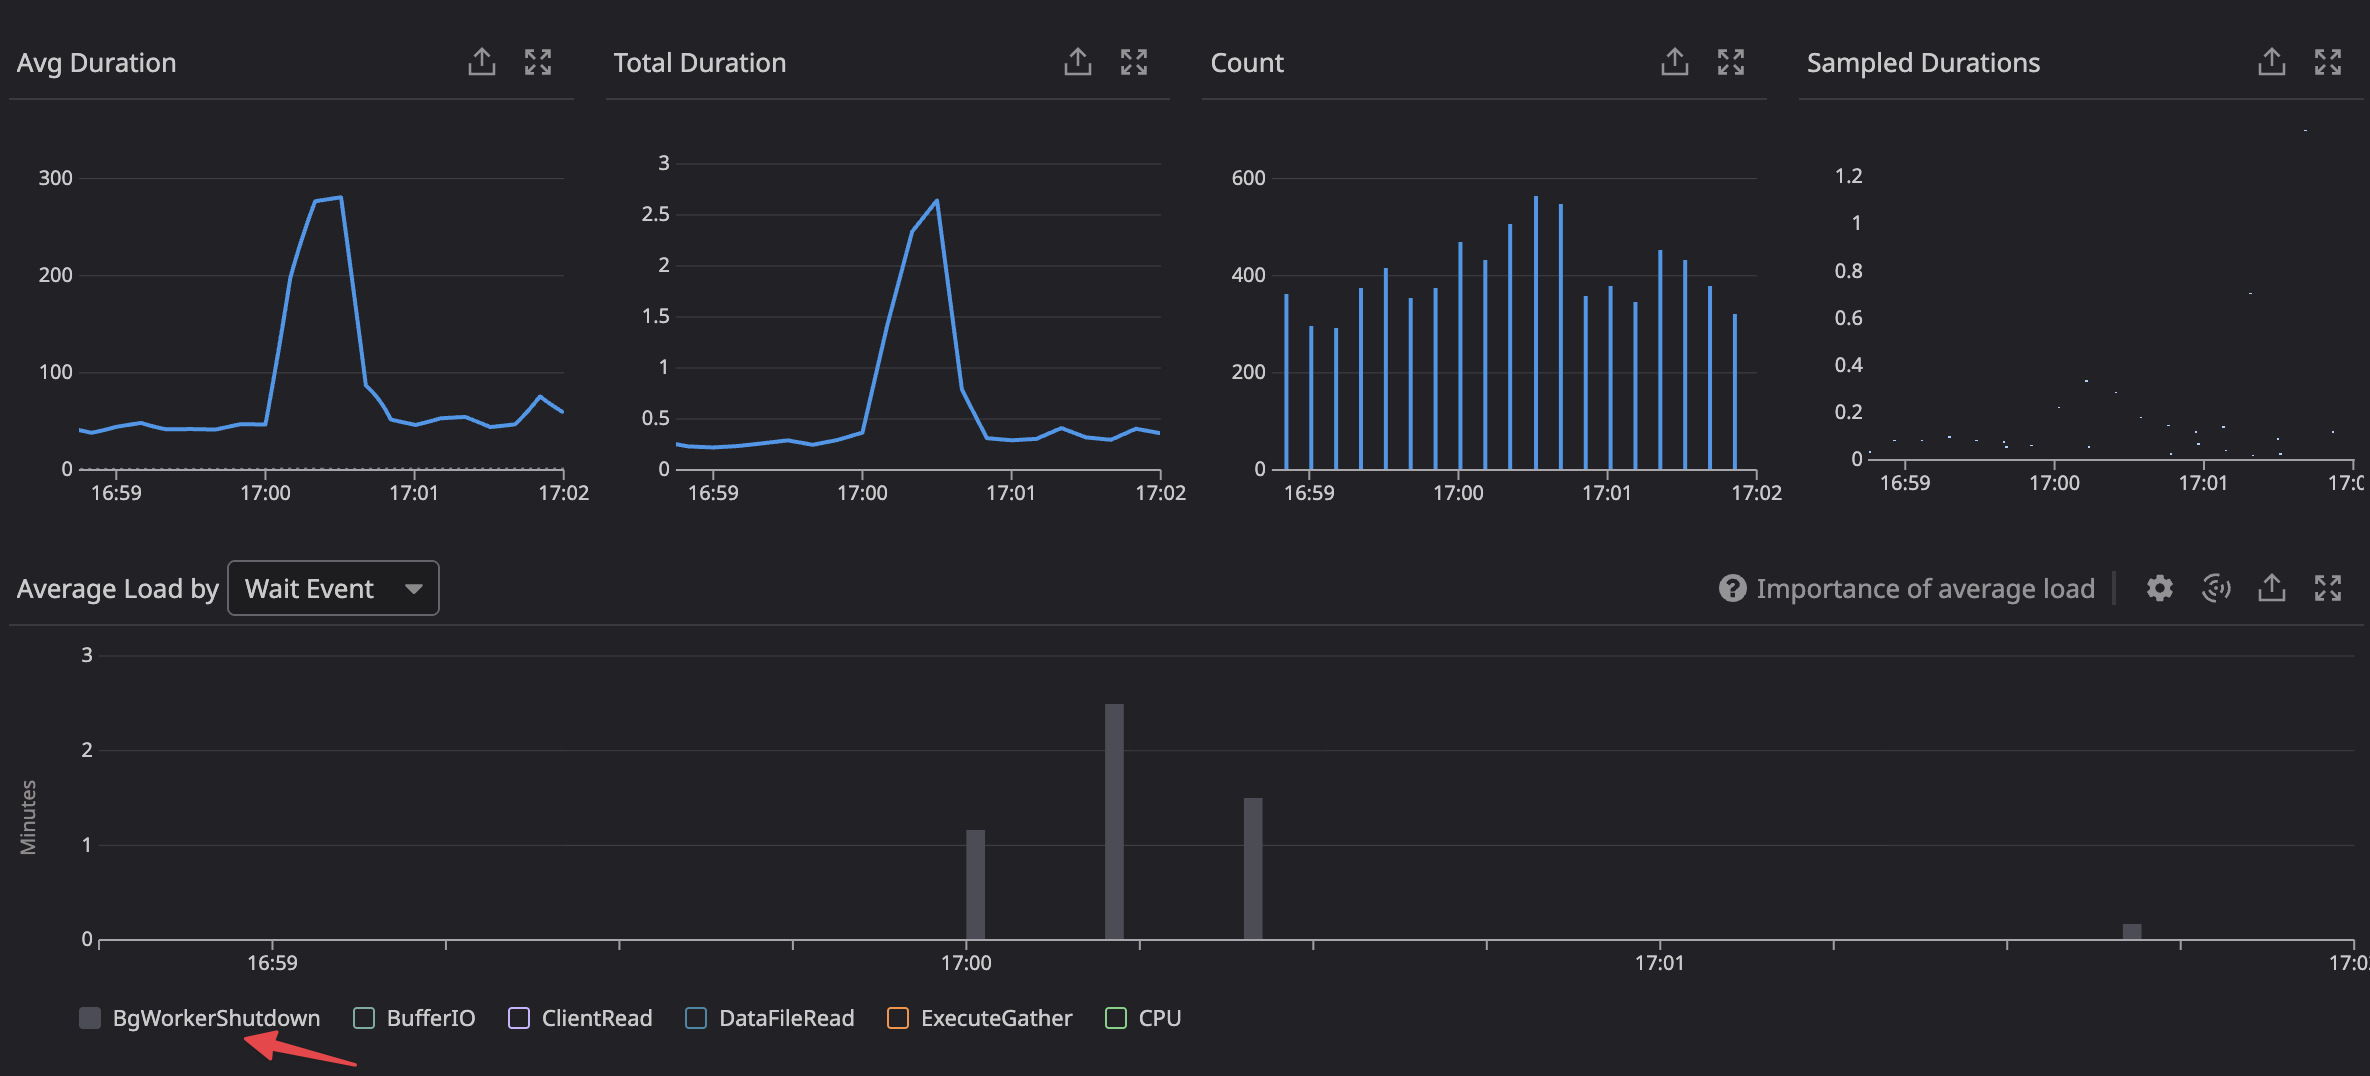
We were able to simulate a high background worker churn in parallel with the connection flood and observed a large decrease connection throughput from the postmaster.
We correlated this query with one our endpoints using a query that triggered a parllel execution plan, that would occasionally coincide with our hourly peaks, resulting in the delayed connections.
Fixing the issue
Now that we deeply understand the failure mode we can mechnically reason about a solution.
- Implementing jitter in our fleet of EC2 instances reduced the peak connection rate
- Eliminating bursts of parallel queries from our API servers
Both of these significantly reduce the pressure on the postmaster.
Conclusion
Many pieces of wisdom in the engineering zeitgeist are well preached but poorly understood. Postgres connection pooling falls neatly into this category. In this expedition we found one of the underlying reasons that connection pooling is so widely deployed on postgres systems running at scale.
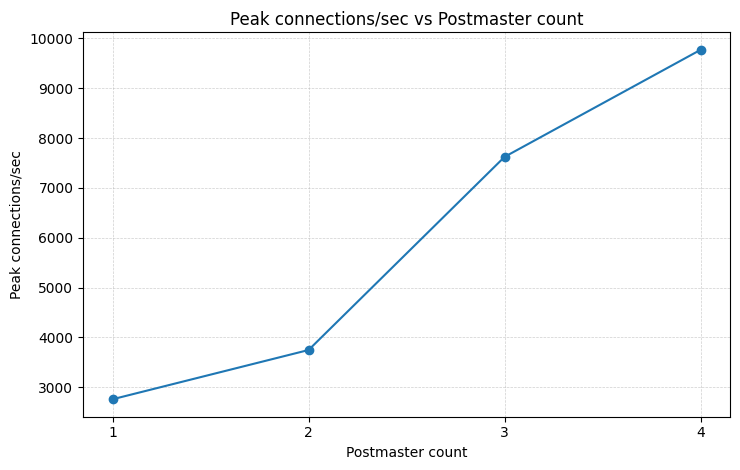
Most online resources chalk this up to connection churn, citing fork rates and the pid-per-backend yada, yada. This is all true but in my opinion misses the forest from the trees. The real bottleneck is the single-threaded main loop in the postmaster. Every operation requiring postmaster involvement is pulling from a fixed pool, the size of a single CPU core. A rudimentary experiment shows that we can linearly increase connection throughput by adding additional postmasters on the same host.
This is one of my favourite kinds of discoveries: an artificial constraint that has warped the shape of the developer ecosystem (RDS Proxy, pgbouncer, pgcat, etc) around it. Hopefully to be lifted one day!
Aside: it's mildly absurd that none of the DBaaS or monitoring tools provide observability into postmaster contention. What's going on here?
